VISCode / Code to diagram, from the code itself
Code to diagram, from the code itself
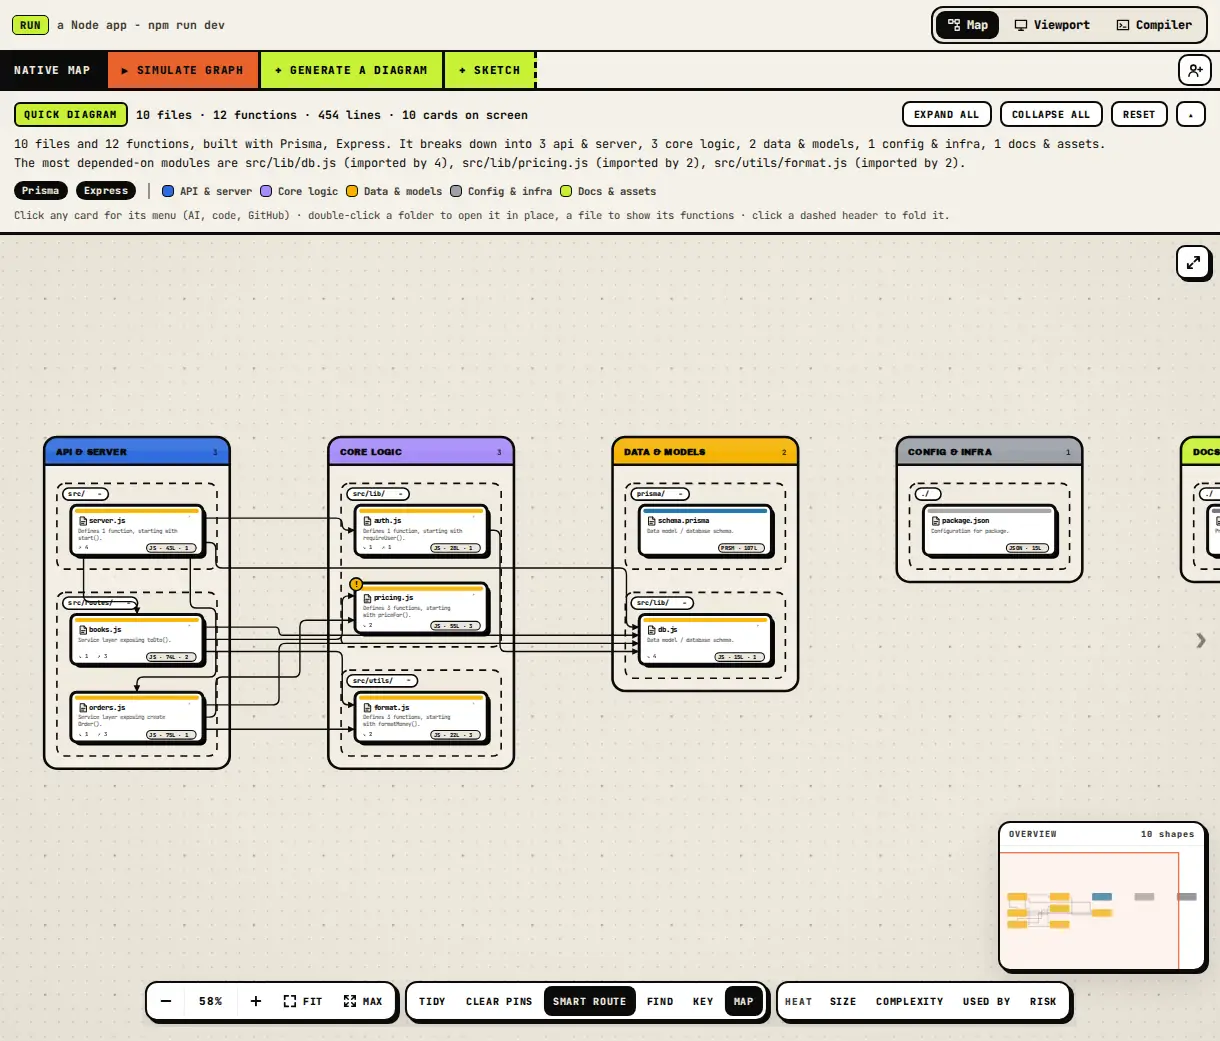
VISCode reads your source and draws it: an interactive map of folders, files and imports, a real flowchart for every function, and 17 generated diagrams - all traced back to the exact lines they came from.
Open VISCode - free Connect your AI
How it works
- Open viscodeai.netlify.app and drop a folder or a zip, paste any public GitHub link, or open the example project.
- VISCode parses 40+ languages in your browser - nothing is uploaded and nothing is executed to read it.
- Pick Quick (the whole repository on one canvas) or Advanced (drill from folders to files to functions), then generate any diagram from the tab bar.
The diagrams you get
- Architecture: project structure, module dependency map, dependency graph, infrastructure map.
- Behaviour: sequence diagram, call graph, state machine, event flow.
- Data: entity-relationship diagram (Prisma, SQL, ORM models), data flow, class diagram.
- Interfaces: API map, components. Quality: hot spots, cycles, unused files.
Why it is different
- Every shape links to its source lines - click to open the code.
- Flowcharts use standard shapes (terminator, process, decision, I/O), generated from the function, not guessed.
- Export a PDF or Word report, or a PNG / SVG of any single graph.
Questions
Is VISCode free?
Yes - VISCode is in public beta and free, with fair-use limits.
Which languages are supported?
More than 40, including JavaScript, TypeScript, Python, Java, Go, C#, C, C++, Rust, Ruby, PHP, Kotlin and Swift.
Is my code uploaded?
No. Maps and diagrams are made in your browser. Only the shape you ask the AI about is ever sent to it.